
The number nobody talks about in digital lending
Everyone benchmarks APR. Everyone compares loan limits and repayment terms. But very few lending teams benchmark what actually drives borrower choice in a saturated market: how fast can I get the money?
We ran a controlled two-loan mystery shopping study across 10 digital lenders operating in Mexico. Same borrower profile. Same device. Same conditions. The goal was simple: measure the real experience of applying for and receiving a short-term loan — not what lenders claim on their landing pages, but what borrowers actually go through.
What we found was a 14-minute gap between the fastest and slowest lenders in the market. And that gap has nothing to do with pricing.
What the data shows
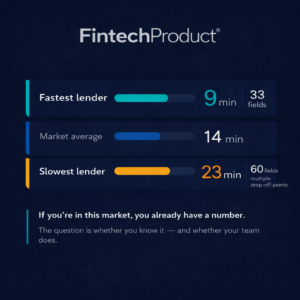
Here is the speed distribution we recorded across the 10 lenders studied:
| Metric | Value |
|---|---|
| Fastest lender | 9 minutes, 33 fields |
| Market average | 14 minutes |
| Slowest lender | 23 minutes, 60 fields |
The fastest lender in our study completed the entire process — registration, identity verification, approval, and disbursement — in under 10 minutes with just 33 data fields. The slowest required nearly two and a half times longer and almost double the number of fields, with multiple observable drop-off points along the way.
This is not a UX problem. It is a conversion problem — and more importantly, it is a repeat borrowing problem.
Why speed determines who gets to the second loan first
In short-term digital lending, the first loan is rarely where margin is made. The real business is in repeat borrowing: the borrower who comes back within 30 to 60 days, requires no new acquisition cost, and already trusts the product.
The lender who approves in 9 minutes does not just win the first transaction. They win the borrower’s mental model of what “getting a loan” feels like. When that borrower needs a second loan, their default choice is the lender that was fast, frictionless, and reliable the first time.
The lender at 23 minutes is not just slower. They are training their borrowers — consciously or not — to look elsewhere next time.
This is the conversion gap that speed creates: not just fewer first loans, but significantly fewer second loans. And in a market where customer acquisition costs are rising, losing repeat borrowers to a faster competitor is a structural problem that no amount of marketing spend can fix.
Where the friction actually comes from
Our methodology measures six dimensions of the borrower journey, weighted by their observed impact on completion rates. The biggest single source of friction — accounting for 25% of our total Friction Index score — is identity verification.
Specifically, we observe four failure points that most product teams underestimate:
1. Liveness and selfie recognition failures. Some lenders require two or three attempts before the system accepts the borrower’s selfie. Each retry adds time and erodes trust.
2. OCR failures on ID documents. When a lender’s document reader fails to extract data automatically, the borrower is forced to enter their information manually — often mid-flow, on a mobile device.
3. Manual validation wait times. A subset of lenders in our study routed borrowers to a manual review queue after the automated step. Wait times ranged from a few minutes to over 24 hours. In a product category where speed is the core value proposition, this is a critical failure.
4. Flow interruptions. Several lenders redirected borrowers out of their native app to complete identity verification via a third-party provider — and then failed to return them cleanly. Some borrowers simply did not come back.
These are not edge cases. They are consistent patterns across multiple lenders in the Mexican market, and they represent measurable abandonment at a critical conversion point.
What this means for product and growth teams
If you operate a digital lending product in Mexico — or are planning to enter the market — the speed benchmark has a direct implication for three teams:
For Product: The friction is concentrated in identity verification, not in the form itself. Reducing fields from 60 to 33 matters, but the bigger gain comes from investing in a liveness and OCR stack that works on the first attempt, every time, without routing borrowers outside the app.
For Growth: First-loan conversion rates are only half the story. The speed at which a borrower completes their first loan predicts their likelihood of returning for a second. If your repeat borrowing rate is underperforming, the application experience is a likely contributing factor — and it is measurable.
For Strategy: The competitive gap in this market is not on the homepage. It is not in the rate calculator or the loan limit. It is in the 14 minutes between your approval and your competitor’s. If you do not know where you sit in that distribution, you are making product and pricing decisions with incomplete information.
How we measure it: the FintechProduct Friction Index
To produce comparable data across lenders, we use a proprietary scoring framework called the FintechProduct Friction Index (FFI). The FFI scores each lender from 1 to 10 across six dimensions, weighted by their observed impact on borrower completion:
-
- D1 — Form fields (20%): Total number of data inputs required
-
- D2 — Time to disbursement (20%): End-to-end process duration
-
- D3 — Steps and screens (10%): Navigational complexity
-
- D4 — Document requirements (15%): Documentary burden on the borrower
-
- D5 — Detected friction points (10%): Errors, timeouts, unclear instructions
-
- D6 — Identity verification (25%): Four sub-dimensions covering liveness accuracy, OCR performance, wait time, and flow continuity
A lender scoring below 4.0 is classified as Low Friction — a competitive advantage. Above 7.0 is High Friction — a structural conversion risk.
In our Mexico study, FFI scores ranged from 2.4 to 8.7 across the 10 lenders tested.
The question worth asking your team
If you are in this market, your lender already has an FFI score. The question is whether your team knows it — and whether they know where your key competitors sit on that same scale.
Most product teams we work with assume they are in the top half of the market on speed and experience. In our data, six out of ten are wrong.
Want the full Mexico benchmark?
We publish competitive intelligence studies on digital lending markets across LATAM, including Mexico, Colombia, Peru, and Brazil. Studies cover the full borrower journey: application, approval, disbursement, and second-loan behavior.
If you want to see how your competitors score — or where your own product sits relative to the market — get in touch.